
Putting the power to model pollution into your hands
At Carnegie Mellon, Professor Peter Adams is working to make sure that everyone who is affected by air pollution has the tools they need to understand the quality of their air.
When we talk about studying air pollution, we typically think of official government agencies and university labs, measuring particles and tracking wind speed—and with good reason. Until very recently, modeling the movement of pollution in the air required very complex calculations—models that often took days and even weeks to run. But air quality affects everyone: not just governments and universities, but average citizens, children, pets. At Carnegie Mellon, Civil and Environmental Engineering (CEE) and Engineering and Public Policy (EPP) Professor Peter Adams is working to make sure that everyone who is affected by air pollution has the tools they need to understand the quality of their air.
Source: Peter Adams
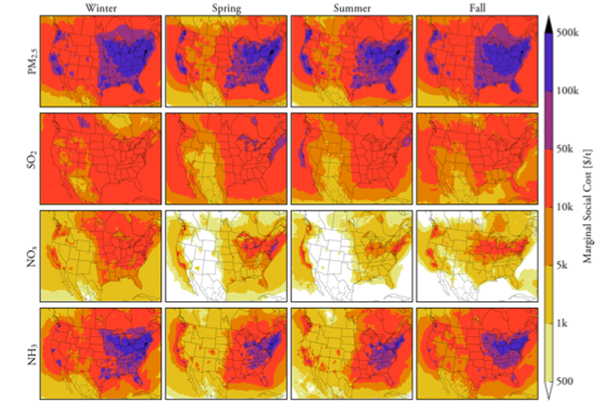
Map of the marginal social costs for ground-level emissions of various pollutants, highlighting the downwind public health costs imposed by those emissions.
Adams’ lab is one of these university labs that creates complicated air quality models, called Chemical Transport Models (CTMs), that can take an inordinate amount of time to run but are extremely comprehensive and accurate. This is due to the many necessary inputs, such as a very detailed description of the 3-D meteorology for the time in question, the emissions of all pollution emitters in the surrounding area, and much more.
“Doing one of these requires both a lot of expertise and a lot of time,” says Adams. “These are the gold standard models, but the days or weeks of computer time is not even the big cost. The big cost is it takes months to prepare the inputs, and then months to analyze the data. It’s definitely not user-friendly.”
U.S. regulations require CTMs to be run in certain cases. For instance, when the EPA rolls out a major regulation, they have to do very detailed modeling to prove the environmental benefits. The EPA has in-house capabilities to run these models. But the responsibility of compliance with EPA regulations falls to the states. When an area is found to not be in compliance with EPA regulations, it falls to the states to come up with a State Implementation Plan, to show how they are going to bring their emissions in line with regulations. What this means is that there is a whole category of researchers and decision makers who care about air quality, but are unable to run one of these models.
“This is the gap we're trying to address,” says Adams. “We’ve built what we call a Reduced Complexity Model that gives essentially the same answer, and it requires no expertise to run. In some cases, it's as simple as multiplying two numbers. Just tell me where and how much you're increasing the emissions of a certain pollutant, and you can basically look up in a table how that will affect human health.”
Just tell me where and how much you're increasing the emissions of a certain pollutant, and you can basically look up in a table how that will affect human health.
Peter Adams, Professor, Civil and Environmental Engineering & Engineering and Public Policy, Carnegie Mellon University
The tool is known as EASIUR: Estimating Air-pollution Social Impact Using Regression. Imagine you emit a ton of a certain pollutant—be it SO2, NOx, or Ammonia. The human health effects will be very different depending on not only the pollutant you emit, but also where you emit, both due to the atmospheric chemistry of the area and the population density. EASIUR is based on extensive models run in Adams’ lab, which have modeled the entire country, broken up into 36-kilometer grids. Using a combination of simulations and statistics, Adams, along with Ph.D. student Jinhyok Heo, has been able to develop a simple, user-friendly table—something that would take a modern computer processor approximately 6,000 years to accomplish. This table can tell you what the human health damages will be if you emit X amount of pollutant in a certain location—not only at the site of emission, but downwind as well.
“Take Pittsburgh Port Authority, for instance,” he says. “Some of our buses are old, relatively dirty diesels. Wouldn't it be nice if they could actually have defensible numbers to say, ‘If I replace an old bus with a cleaner one, the NOx emissions go down, and this many lives will be saved.” Then, they can use this data to sell the idea of switching to a cleaner bus model. This is the kind of application that EASIUR is perfect for.”
Thanks to Adams’ new, easy-to-use modeling tool, everyone who is affected by the negative health effects of air pollution will be able to have access to the information necessary to address the problems, without having to sacrifice accuracy.